A few weeks ago, I found myself thinking about a pattern that most engineering teams know too well. Your API works fine in staging. Every test passes. You ship it. Then something breaks in production, and it is not because the code was wrong. It is because something around the code changed and nobody noticed.
An API key quietly expired. A payment provider changed how it responds to a request. A policy update silently blocked a call that used to work. Someone merged a database query that works fine at low traffic but chokes under real load. An endpoint that nobody remembers building is sitting there without authentication. A response somewhere is leaking a piece of data it should never expose.
None of these are wrong code problems. They are nobody was watching problems.
Modern teams do not write everything themselves anymore.
Why this keeps happening more, not less
You depend on external APIs, shared libraries, and code from other teams. Add the shift to microservices, you get dozens of small moving parts that all have to keep working together, all the time. Checking API health is not an extra step. It is basic
Plenty of monitoring tools exist already. Big, small, free, expensive. But most teams do not need everything they offer, and end up paying for complexity they never touch, or bending their workflow to fit someone else’s design.
That is why I built this myself. Not because other tools fail, but because something smaller and purpose-built fits a team’s actual habits instead of asking the team to adjust.
This is the exact problem I built VizhiOps to solve.
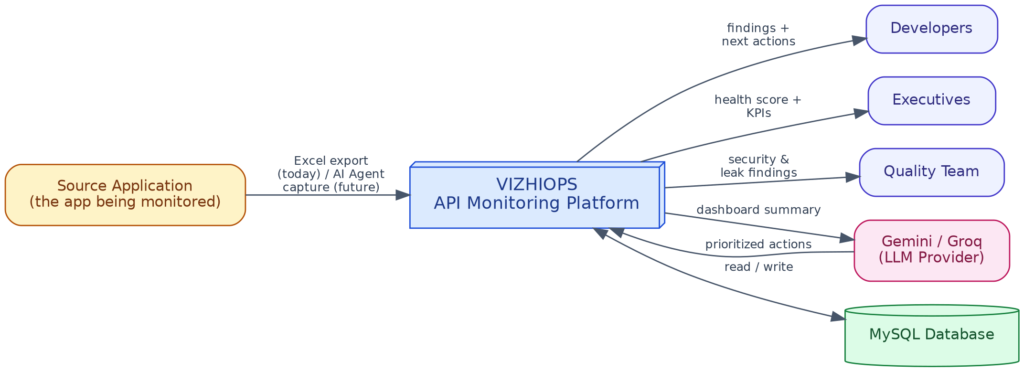
VizhiOps is an API monitoring tool. At its core, it looks at the endpoints your application exposes, the traffic they get, and the problems hiding inside them, and it turns all of that into something a human can actually read and act on.
It is built for three kinds of people, because each of them needs something different from the same data.
Developers need to know exactly which endpoint has a problem, how serious it is, and what to do about it.
Quality teams need to see every security and data leak issue across the whole system, no matter which team owns the endpoint.
Executives and engineering managers need one honest number that tells them how healthy their APIs are, without having to read logs or ask a developer to explain it to them.
How data gets into VizhiOps
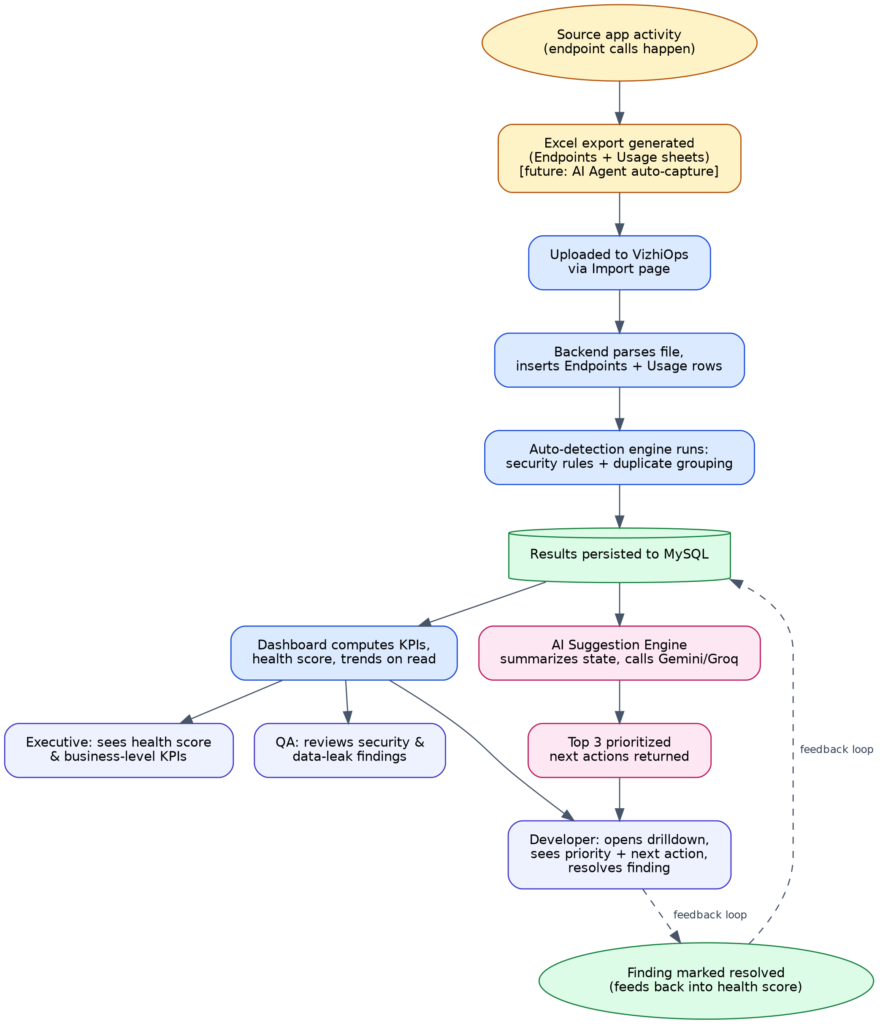
Right now, data comes in through a simple Excel file. One sheet lists the endpoints. Another sheet lists how those endpoints have been performing, day by day. You upload the file, and VizhiOps takes it from there.
The moment that file lands, VizhiOps automatically checks every endpoint against a set of rules. Does it require authentication? Does its path expose something sensitive, like a password or a token, directly in the URL? Is it a near duplicate of another endpoint that already exists? All of this happens without anyone clicking a second button.
This was a deliberate choice. The file format is not the important part. What matters is the shape of the data, endpoints and their usage. That means the Excel upload can later be replaced by something smarter, like an agent that watches real traffic and pushes data in automatically, without changing anything else about how VizhiOps works underneath.
The one click part
Once your data is in, VizhiOps builds a dashboard around it. You get a health score, which is simply the percentage of your active endpoints that have no unresolved security or data leak problems. You get a list of security findings, sorted by how serious they are. You get a view of your slowest endpoints and the ones nobody is using anymore. You get a list of duplicate APIs that probably should not exist twice.
Click into any single endpoint and you see its full story: how it has been performing over time, every finding attached to it, and whether it is part of a duplicate group.
But the part I care about most is this. VizhiOps does not stop at telling you something is wrong. It looks at everything happening across your system right now and tells you the three things you should actually do next. Not a wall of alerts. Three clear, ranked actions. This part is powered by a language model that reads a short summary of your system’s current state and responds with real, specific suggestions, not generic advice.
You do not have to go digging through logs to figure out where to start. VizhiOps already did that part.
Built for the way real teams work
I did not want this to feel like a heavy platform that needs its own team to run. It is split into clear parts: one stores your data, one detects problems, one talks to the AI model. Each does one job. That keeps it simple to understand and easy to extend later.
What comes next
The Excel upload is a starting point, not the destination. The next step is removing the manual part, so data gets collected and sent in on its own, on a schedule. After that comes something harder. Instead of only checking against fixed rules, an agent would actually look at what is happening and notice things nobody thought to write a rule for. That is when VizhiOps stops reporting on your system and starts watching it.
A closing thought
There is an old Thirukkural verse that stayed with me while building this.
வருமுன்னர்க் காவாதான் வாழ்க்கை எரிமுன்னர்
வைத்தூறு போலக் கெடும்
It means a life that does not guard against trouble before it arrives will be destroyed the way dry grass burns once fire reaches it. Just the natural result of not preparing in time.
That is the entire idea behind VizhiOps. Production problems rarely arrive without warning. Most of the time, the warning was already there, sitting quietly in a log, a slow response, an endpoint with no authentication, a piece of data that should never have been exposed. The damage happens because nobody was watching closely enough to catch it before it spread.
VizhiOps exists to be that watchful eye. Not to replace your judgment, but to make sure you see the fire while it is still small enough to put out.
Links
Github Link – https://github.com/lochana38/VizhiOps